


Trial Court Case Filing Trends – Aggregated by Fourth Court of Appeals Region
This post has been viewed 2,377 times.
After a COVID-19 drop in April new case filings, the trend has been back toward the average. District and County court clerks report data to the Texas Office of Court Administration (OCA) based on cover sheet categorizations. CourtStatPack.com presents OCA data in easily customizable graphs to quickly spot trends. Here are some highlights from trial courts in the Fourth Court:
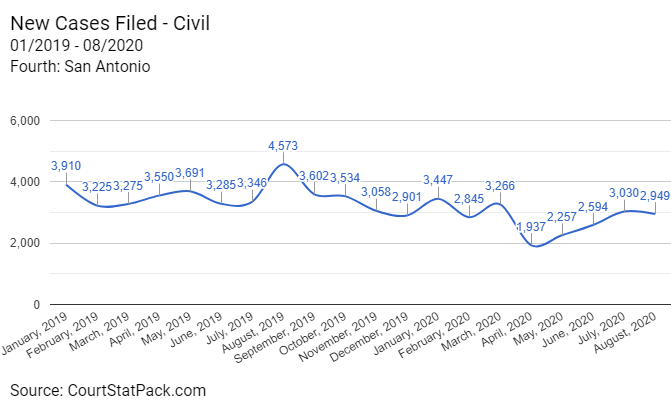
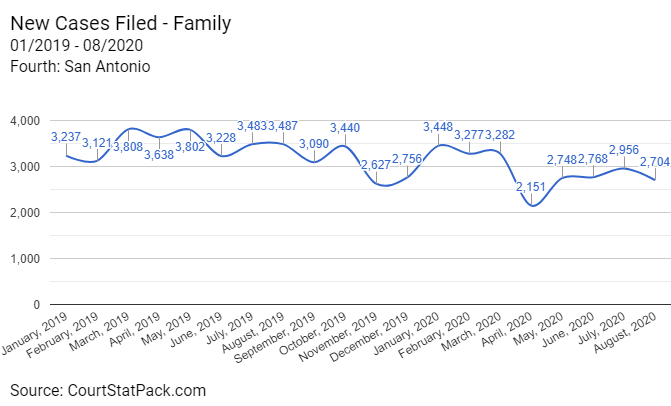
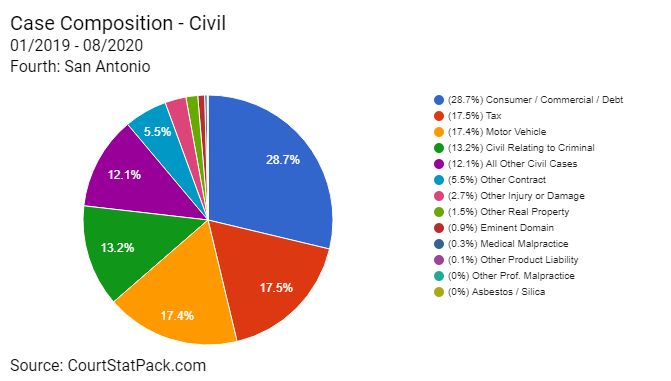
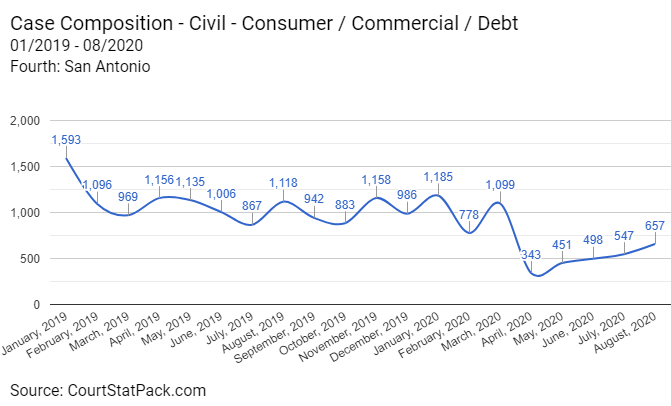
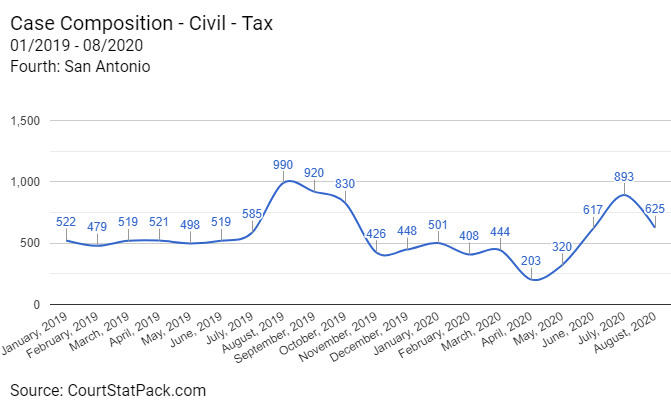
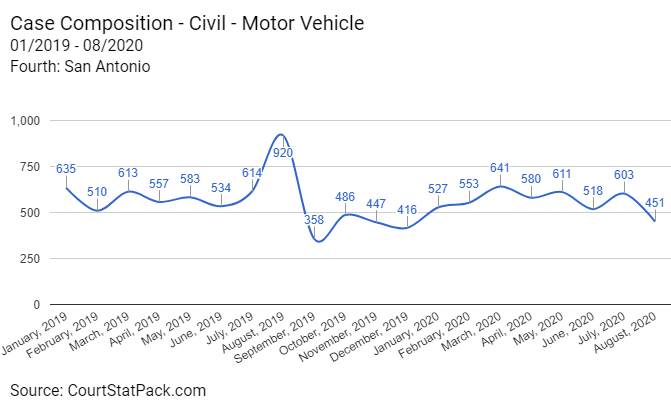
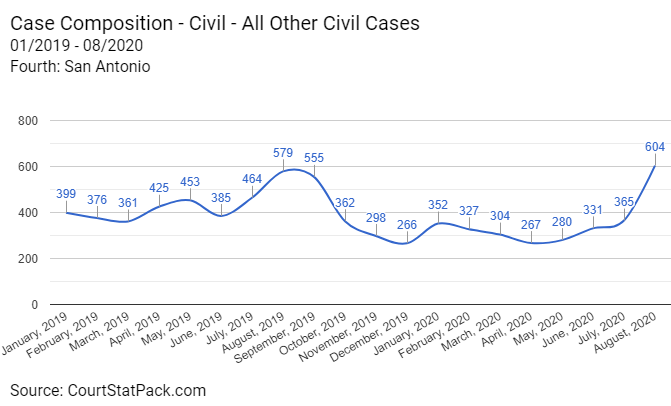
By default, CourtStatPack.com presents annual trends statewide. By clicking on the pie charts, users can drill down into trendlines.
Customize the Reports. The “Options” box in the upper left corner, allows users to modify the venue and date range. By clicking the edit pencil, users can make geographic and date range choices. Simply push “Reload” after making your selections and the charts will be regenerated using your filters.
These charts pull data for trial courts in the Fourth Court region from January 1, 2019 through the last reporting period (August 31, 2020) to focus on COVID-19 trends.
OCA began compiling data in its current form in September of 2010. The various clerks periodically update their data so the specific numbers can change.
Many of the high-level graphs Statewide and by metro areas were published in a series of blog posts at ADRtoolbox.com. Attorney-Mediator Don Philbin published Bexar County specific articles in 2016 and 2018.
Read original articleTags: